24 Mar 2025 Joseph Chanov
145% Price Surge For SPX, Are Meme Coins Resurrecting?
Meme coins have had a bad start in 2025, plummeting roughly 70% year to date. The sudden drop appears to be a reflexive one, given that meme coins outperformed the market as a whole in 2024.
Signs of a comeback are appearing. March saw a comeback, driven by the SPX and FARTCOIN. The former's price surge is particularly spectacular because SPX has cleared numerous key resistance levels, paving the path for a comeback to its all-time high.
The daily analysis reveals that the SPX price fell below a falling resistance trend line after reaching an all-time high of $1.77 on January 19.
The downward momentum peaked on March 11, with a low of $0.25, representing an 85% decrease from the high but not a new all-time low.
SPX has rebounded impressively since the lows, breaking out from the trend line on March 19, 59 days after it was formed.
Today, the SPX price is attempting to retake the $0.60 horizontal support level. Doing so would be incredibly beneficial to the bulls because the area has served as support for several months.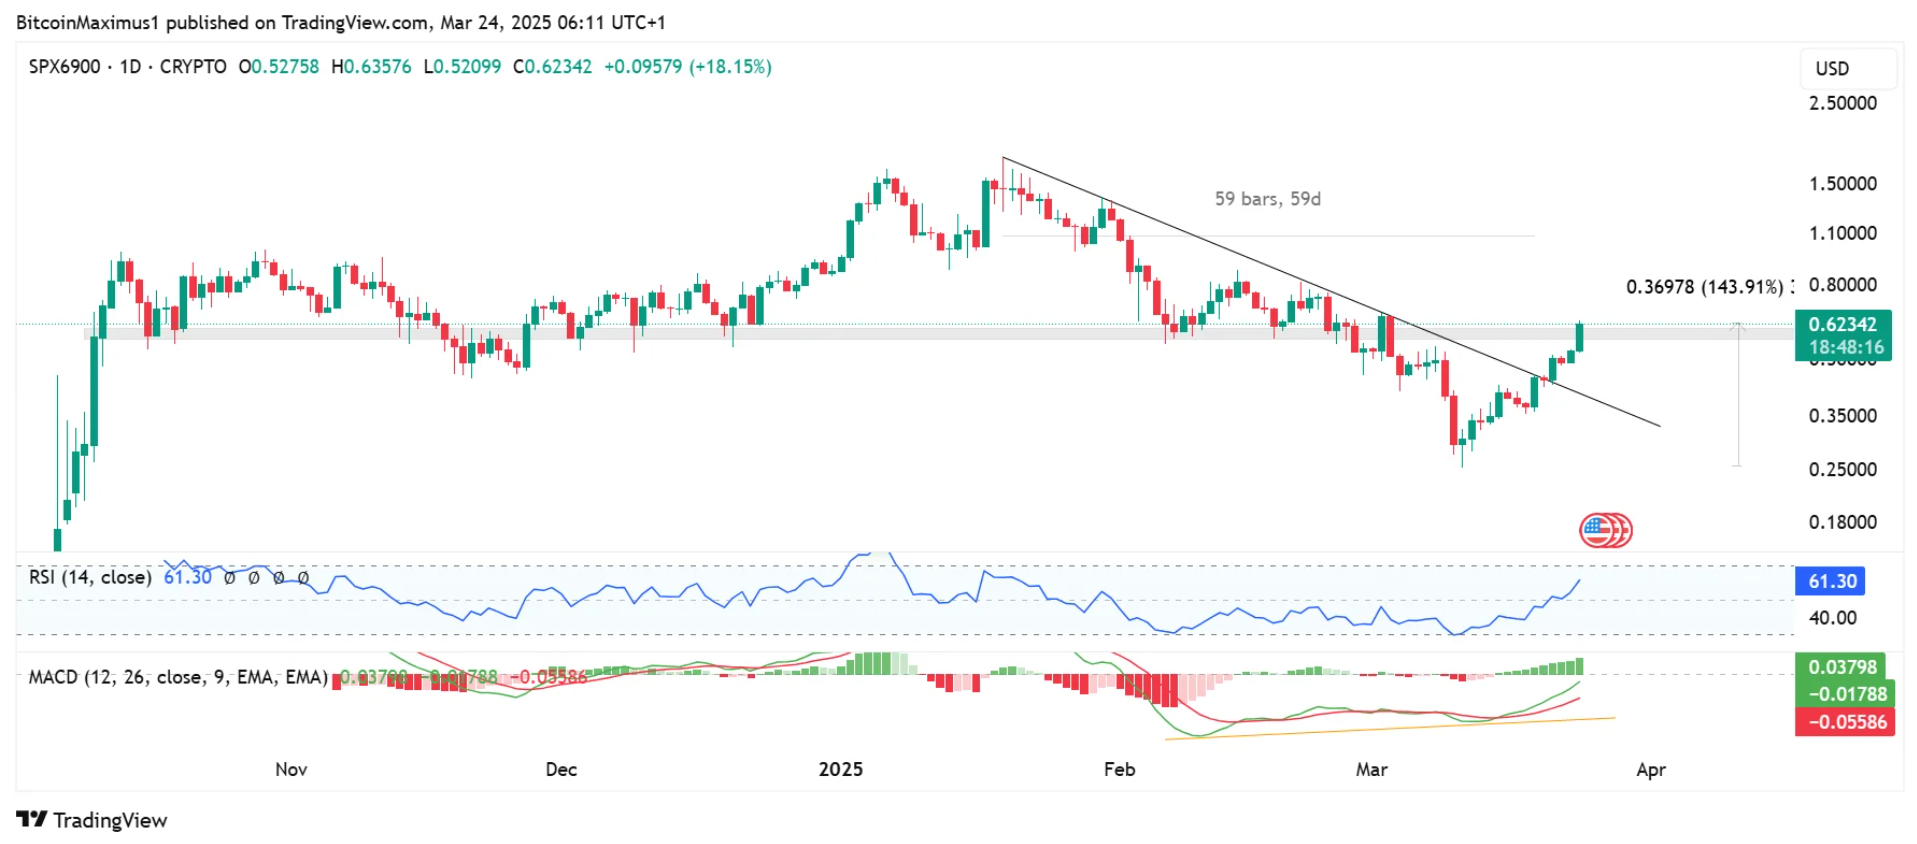
Source: TradingView
Technical signs support this breakout. The Relative Strength Index (RSI) is rising and has just surpassed 50.
The Moving Average Convergence/Divergence (MACD) indicator showed a bullish divergence and is virtually positive. The daily time frame chart indicates that SPX will close above $0.60 and continue to rise toward its highs.
While price action and indications point to a positive SPX projection, the long-term wave count is negative. Since its commencement, the count has shown a completed upward A-B-C structure (in black) and a downward five-wave drop. If correct, this shows that the long-term trend is bearish, and the SPX's higher movements are corrective rallies.
In terms of the current advance, the count indicates that it is an A-B-C corrective structure, following which the SPX price will fall again. However, the count indicates more gains before the trend reverses. The SPX price could be in wave A of an A-B-C structure, with the 0.618 Fibonacci retracement resistance at $1.18.
Following that, the SPX price could resume its downward trend, reaching new lows.
Failure to break out of the $0.60 resistance area will not jeopardize this count. Rather, it will mark the end of wave A and the beginning of corrective wave B.
Following a severe decline, the SPX price recovered, reclaiming two key resistance levels.
Even if the rising surge is corrective, the SPX price can rise to $1.18 before perhaps declining again.