29 Jun 2018 Arjun Agarwal
Crypto Market Insight: Ethereum’s Price Falls Down Despite Sell-off
With an ETH/USD support level of $420, the market saw an ETH/BTC decline below the 0.0700BTC support level, even reaching 0.0680BTC and 0.0650BTC.
Examining the coin’s behavior in more details, the 2-hour chart below shows that the ETH/USD didn’t manage to gain momentum at the $440 resistance, which caused the further price drop. Ethereum’s sellers broke the support level of $420.
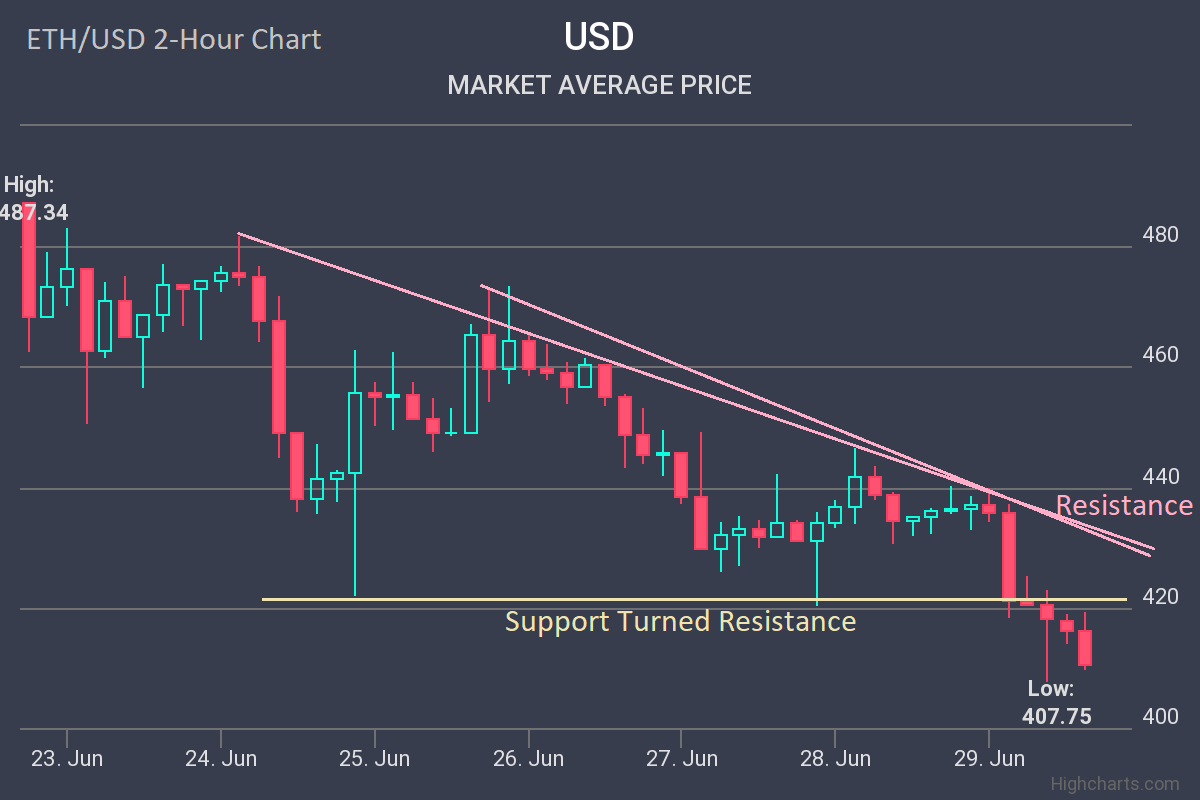
Ethereum reached its all-time and monthly lowest price of $410, ringing an alarm for Ethereum’s community. With new support at $400, market analysts warn that the price might as well drop down further, reaching $380 and $375.
Looking at the topside, the broken $420 support might turn into a resistance level. In order to avoid further losses, Ethereum needs to break the $430 and $440 levels.
With regards to the 30-minute ETH/USD data on the graph below, analysts spot a significant downtrend under $420.00.
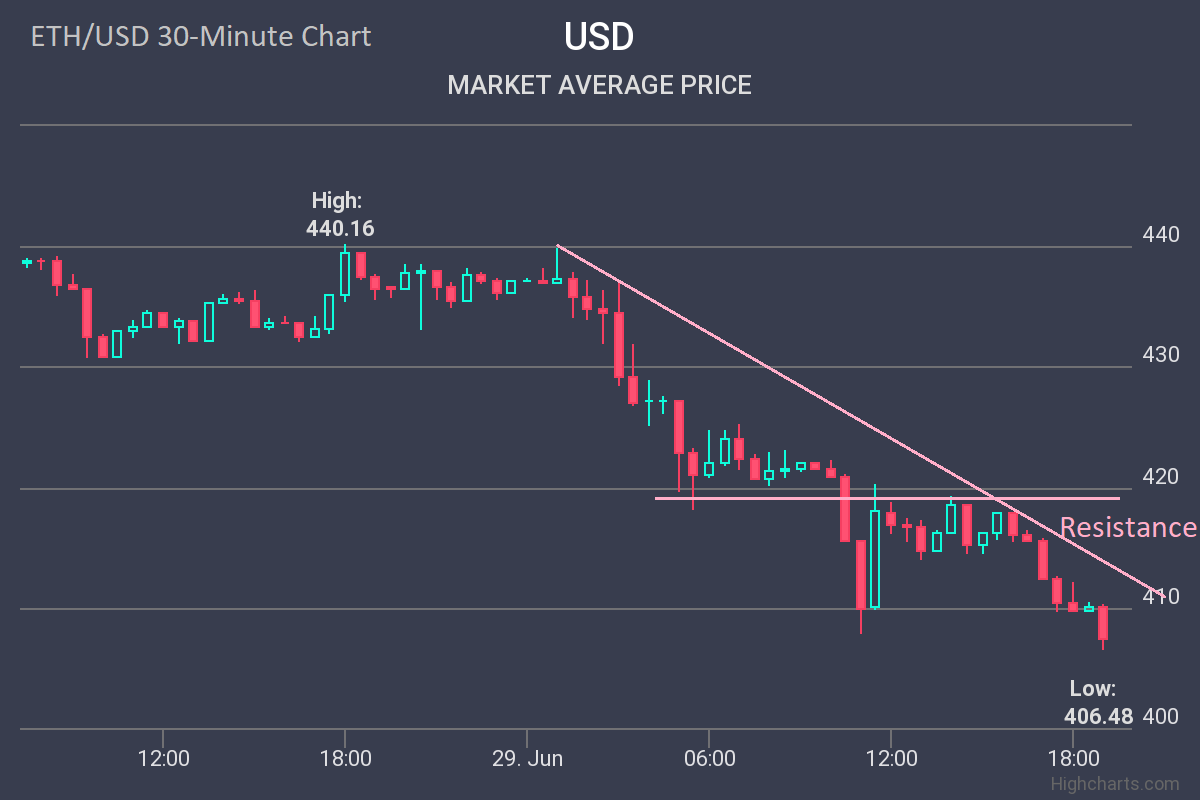
An initial resistance is kept active at the $412 price and a bearish trendline followed by $420.00 and $430.00. The chart and behavior of the coin on the market alarm about a possible further price drop. The ETH/USD exchange is likely to reach a bearish break lower than $400.
Ethereum Crypto Market eth crypto market monitoring Ethereum news etherium cryptocurrency news crypto news Crypto Price Ethereum Price