05 Feb 2024 Simon Briggs
FLARE Prices Explode, Are Bulls In Charge For The Token?
The Flare token has seen a rise in valuation of more than 5% despite the bearish momentum in the cryptocurrency industry, suggesting that this token has a bullish influence in the market.
For a short while, the Flare price moved in a closed range between $0.01649 and $0.01833, but then the market picked up steam and the price broke out of the range. Before being rejected at $0.02346, the price had increased by more than 42%.
After that, the price spent more than two weeks trading in a consolidated range between $0.02026 and $0.02346, indicating a weak market reaction for the coin.
Following several unsuccessful attempts, the FLARE token managed to break through the resistance level, resulting in a valuation increase of roughly 27.5%.
After that, the price encountered resistance at $0.02844 and briefly moved sideways.
In just two days, the flare price added more than 26% to its portfolio as the market picked up steam. The price then encountered resistance at $0.03253 and has been moving sideways ever since, indicating a cooling off in the price movement.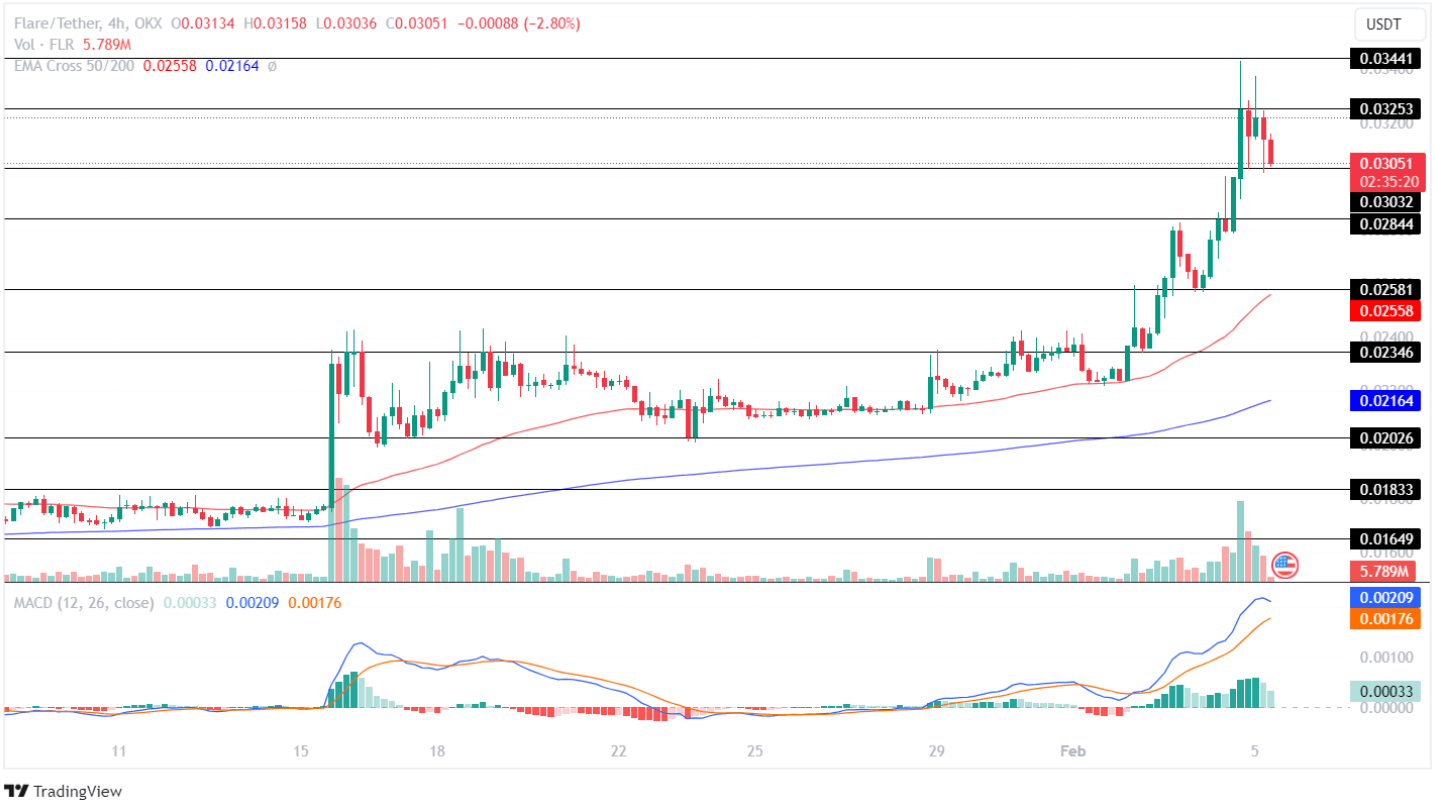
Source: TradingView
Will Flare Prices Rise Once More?
The green histogram shows a decline in the Moving Average Convergence Divergence (MACD), which suggests an increase in selling pressure on the coin. Additionally, the average displays a bearish curve, emphasizing the bearishness of the cryptocurrency market.
The FLARE price will pick up steam and test its resistance level of $0.03253 this week if the market maintains its price above the support level of $0.03032.
On the other hand, the price will lose momentum and drop to test its lower support level of $0.02844 if the bears manage to push it below the support level of $0.0302. Furthermore, the market will continue to decline and get ready to test its critical support level of $0.02581 if the bears maintain their dominance.
The bigger picture
It seems that the global crypto market is in an accumulation phase, despite the bearish momentum. In fact, the crypto industry market cap has been moving sideways over the past 30 days, floating around $1,66 trillion. Some experts explain the sideways action with portfolio diversification.
Trading volumes, however, are on a rollercoaster ride, as over the past 30 days the trading volumes went from a high of $140 billion on January 11, to a low of $29 billon on February 4.
Bitcoin’s dominance over the other cryptos is also stable, with slight fluctuations around the 51% mark, while Ethereum managed to lose 2% over the past 30 days, reaching a current level of 16,9%. The third most dominant crypto is Tether (USDT), which accounts for roughly 6% of the entire crypto market capitalization.
The Crypto Fear & Greed Index, which measures the overall sentiment in the sector, is now slightly below the Greed zone, reaching a value of 54,56, as of press time. The indicator shows how buyers and sellers are interacting with each other – as the index goes into the greed zone, investors are more likely to buy cryptos at higher prices. Contrary, if the overall market sentiment is in the Fear zone, more sellers are willing to cash out, pushing the prices down.
Bitcoin Ethereum Tether btc eth Bitcoin price token cryptocurrency news crypto news Crypto Price Ethereum Price USDT