21 Mar 2025 Jane Whitmoore
KAVA Surges 130% To Near A 1,300-Day Breakout
In 2025, the cryptocurrency market reached new lows, but KAVA has defied them. Conversely, since August 2025, KAVA has demonstrated resiliency by setting back-to-back higher highs.
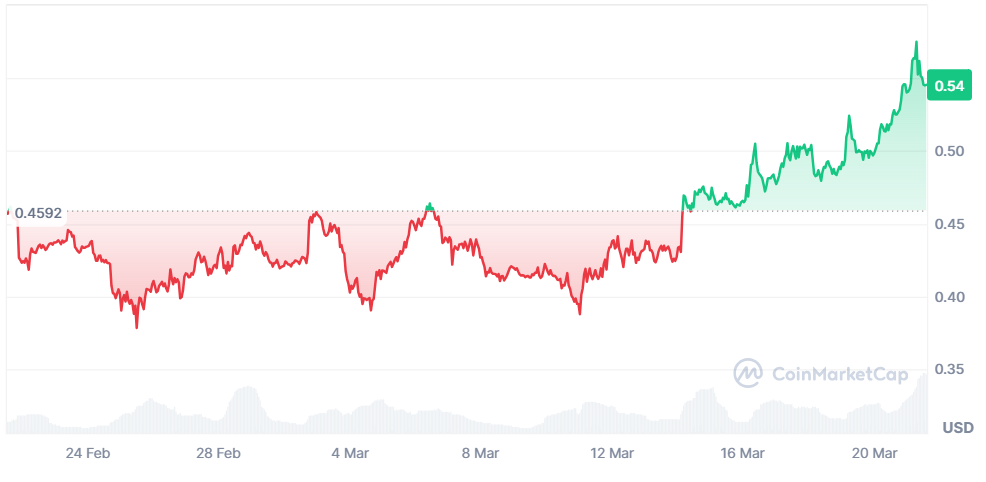 Source: CoinMarketCap
Resistance is now a crucial test for KAVA. The crucial question is whether it can overcome these obstacles and confirm its trend reversal as momentum builds.
According to the weekly analysis, after reaching its peak of $8.80 in August 2021, the price of KAVA has dropped below a falling resistance trend line.
Three years later, KAVA had dropped to a low of $0.25, barely rising above the previous low of $0.24. Since then, KAVA has recovered well, hitting a number of high lows.
The resistance trend line and the $0.56 horizontal resistance area are the targets of the price's effort to break out this week. $1.10 is the next point of resistance.
Technical indicators have a bullish inclination. Both the Moving Average Convergence/Divergence (MACD) and the Relative Strength Index (RSI) are rising.
Both indicate that the trend is bullish: the former is above 50 and the latter is positive.
The bullish chart that KAVA has against Bitcoin (BTC) is another intriguing development. KAVA has risen since January when it hit a new all-time low.
The price of KAVA emerged from a declining resistance trend line, just like it did on the weekly time frame. A breakout over the 670 satoshi resistance level, where the price is currently trading, could quicken the upward trend.
Because the indicator completed a swing failure pattern by moving above 50 and produced a bullish divergence prior to the breakout, the RSI reading is extremely positive.
As a result, KAVA is among the few cryptocurrencies that show a positive chart in relation to both Bitcoin and the US dollar.
The daily time frame is more hesitant to provide a positive KAVA prediction, mainly due to the wave count, even though the weekly time frame is bullish.
The long-term rally beginning in August 2024 and the short-term one beginning in December are both three-wave structures, according to the wave count.
This indicates that the general trend is still negative and that the rallies are corrective. If this is true, the price of KAVA is in wave C of an A-B-C structure, and a decline will ensue.
Wave C may continue to the next horizontal resistance at $0.70 or terminate at the resistance trend line of the parallel channel at $0.60. However, as long as the price is below $0.70, it is probably a relief rally.
However, a closing over $0.70 would cast doubt on the veracity of the count and would push the price of KAVA to the next long-term resistance level, which is $1.10.
A long-term diagonal and horizontal resistance level is the target of KAVA's breakout effort. The daily chart indicates that the advance is corrective and will soon come to an end, notwithstanding the long-term chart's bullishness.
The misalignment of the time frames makes it difficult to determine the direction of the trend. The trend for the remainder of the year can be understood based on whether KAVA closes over $0.60 or is rejected.