23 Jul 2021 Josphat Kariuki
BTC On-Chain Analysis Indicates Historic Bottoms
Technical indicators like the ratio between the realized and market capitalization (MC) levels are leading crypto analysts to believe Bitcoin is in for a bottom.
Bitcoin’s total market capitalization is calculated by multiplying the mined coins by the price per coin. The realized cap (RC) has a similar approach for calculation but takes into consideration the price at the time of the most recent Unspent Transaction Output (UTXO). The realized cap measurement is rejecting BTC coins that are lost or that haven’t moved in a considerable period of time.
The realized cap reached an all-time high of $377,795 Billion on May 15, 2021 - roughly one month after the market cap reached its all-time high. Since then, the RC value for Bitcoin is heading down, reaching $362 billion, as of press time. The RC drop means BTC holders are selling coins at a loss, resulting in roughly $15 billion in losses in the Bitcoin market.
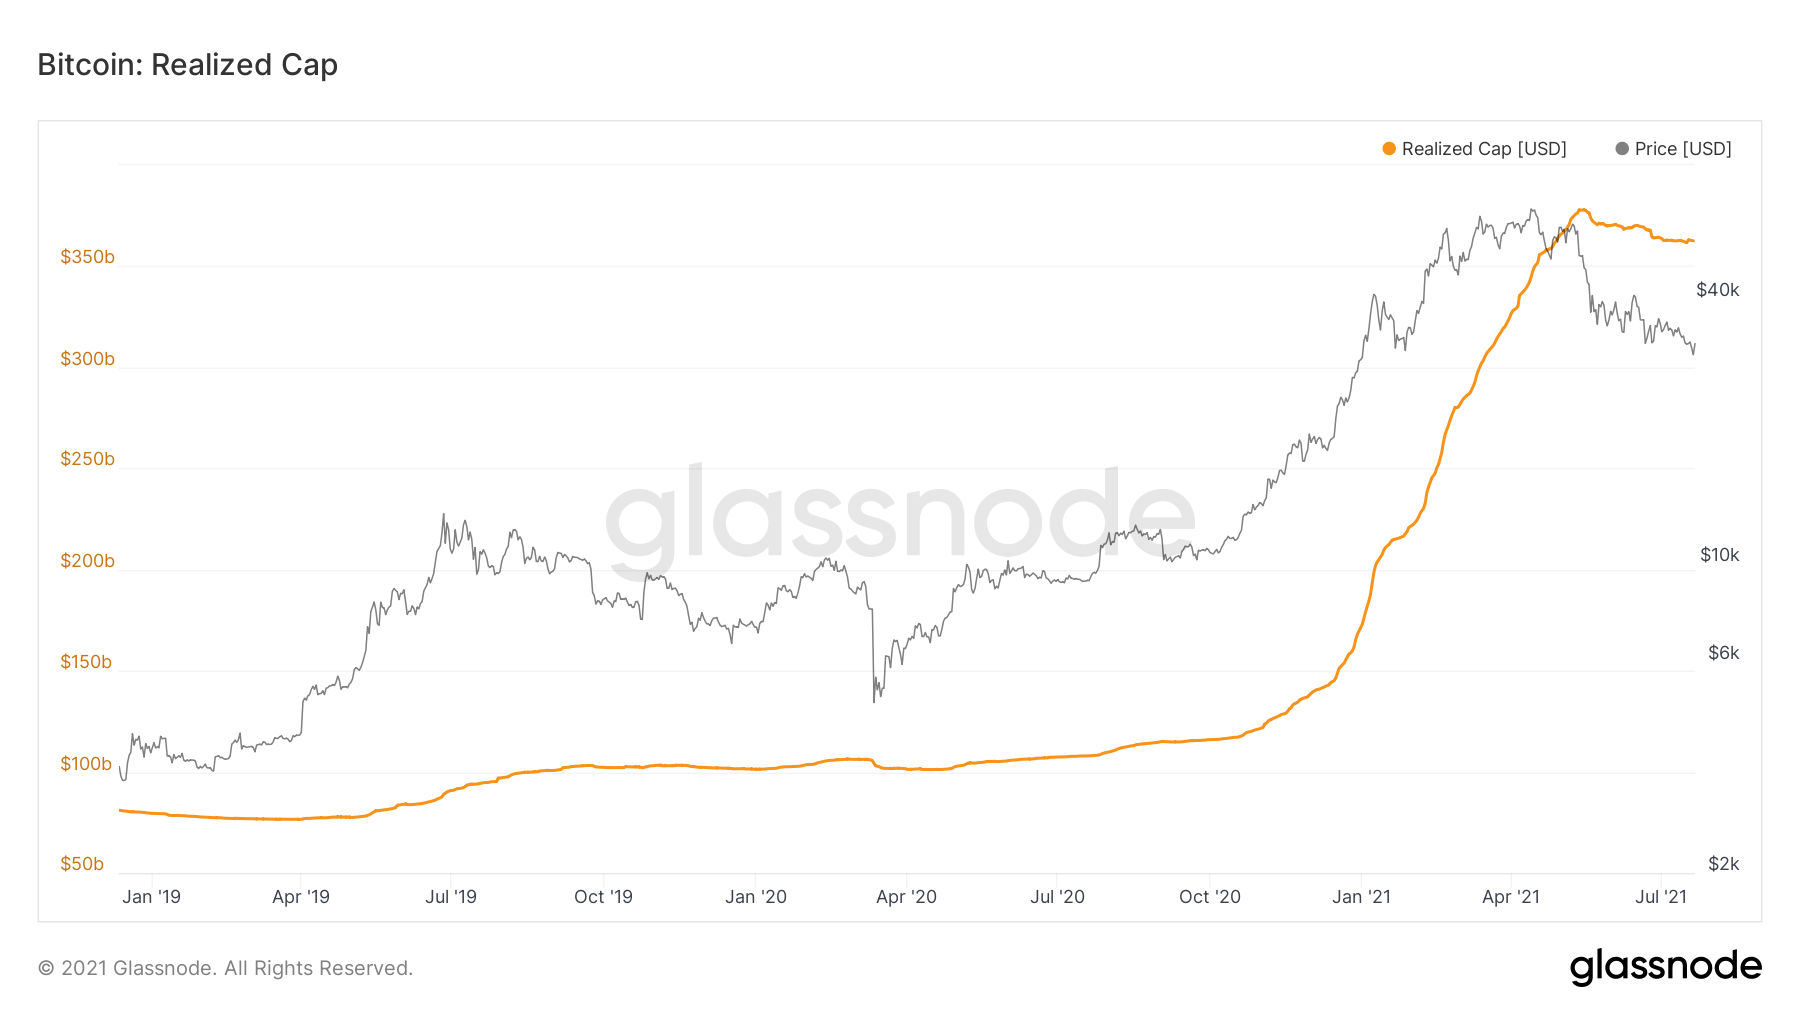
Source: Glassnode
Meanwhile, a closer look at the historical movement of the market capitalization indicator shows that MC has fallen below RC in December 2018 and March 2020. These two periods of time coincide with Bitcoin’s cyclical bottoms.
And while in 2018 the MC indicator stayed below RC for five months, the March 2020 COVID-19 market crash only managed to hold the market cap below the realized cap for a month.
However, the current ratio between RC and MC shows that realized cap is 64% of the market cap, which is a bit high, given that the ratio usually sits below 50%. In contrast, when Bitcoin reached the market cap all-time high in April 2021, the realized cap was only 25%.
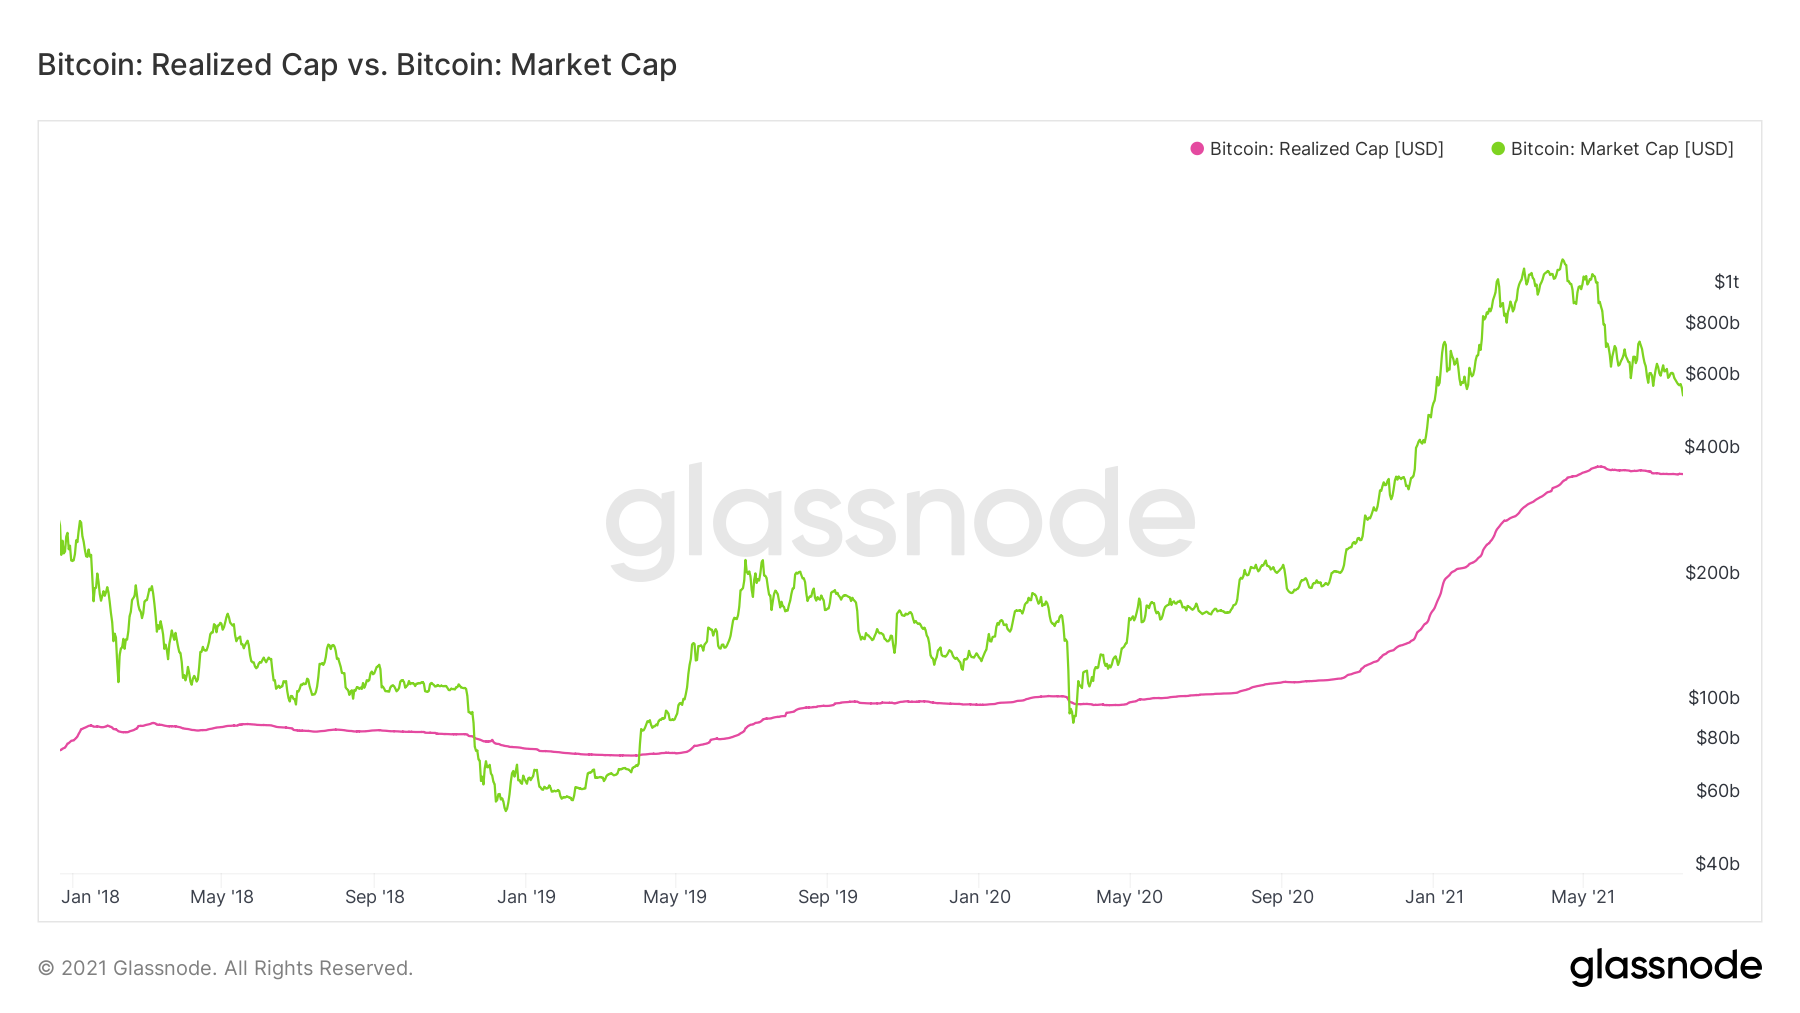
Source: Glassnode
Such a high ratio usually suggests a local bottom, as it turned out on Jan. 17, (78%) & Aug. 21, (66%) 2016. Also, the ratio went up on Jan. 13, (55%) and March 25,(52%) 2017. All four examples denote local lows for the world’s largest cryptocurrency to date.
Usually, after a local low, the ratio retreats below 50% and a bull run begins. However, the latest price swings are far from a bull run. Nevertheless, Bitcoin seems to have entered a recovery mode, gaining 4 percent weekly, trading at $32,448.28 as of press time.
The rest of the crypto sector is mostly following suit, with Ethereum spiking 9% weekly to trade at $2,069.86. Other crypto projects in the top-50 list, with minor exceptions, are all up 5-9% weekly, which may be a sign of a consolidation period ahead for the crypto sector.
Bitcoin Cryptocurrency Crypto Market btc crypto market monitoring bitcoins cryptocurrencies bitcoin news cryptocurrency news bitcoin news today Market Capitalization cryptocurrency market