22 Jan 2024 Arjun Agarwal
UMA’s Price Triples In A Week, Is The Upward Momentum Continuing?
Investors in cryptocurrencies have been paying close attention to UMA, the native token of the Universal Market Access Protocol, especially because of its remarkable performance in an uncertain market. The price of UMA has surged by over 200% in the last four days, reaching an incredible 20-month high of $6.40, according to data from Coinmarketcap. This spike signals the end of a protracted accumulation phase and the beginning of a bullish reversal trend that may open the door for further, steady growth.
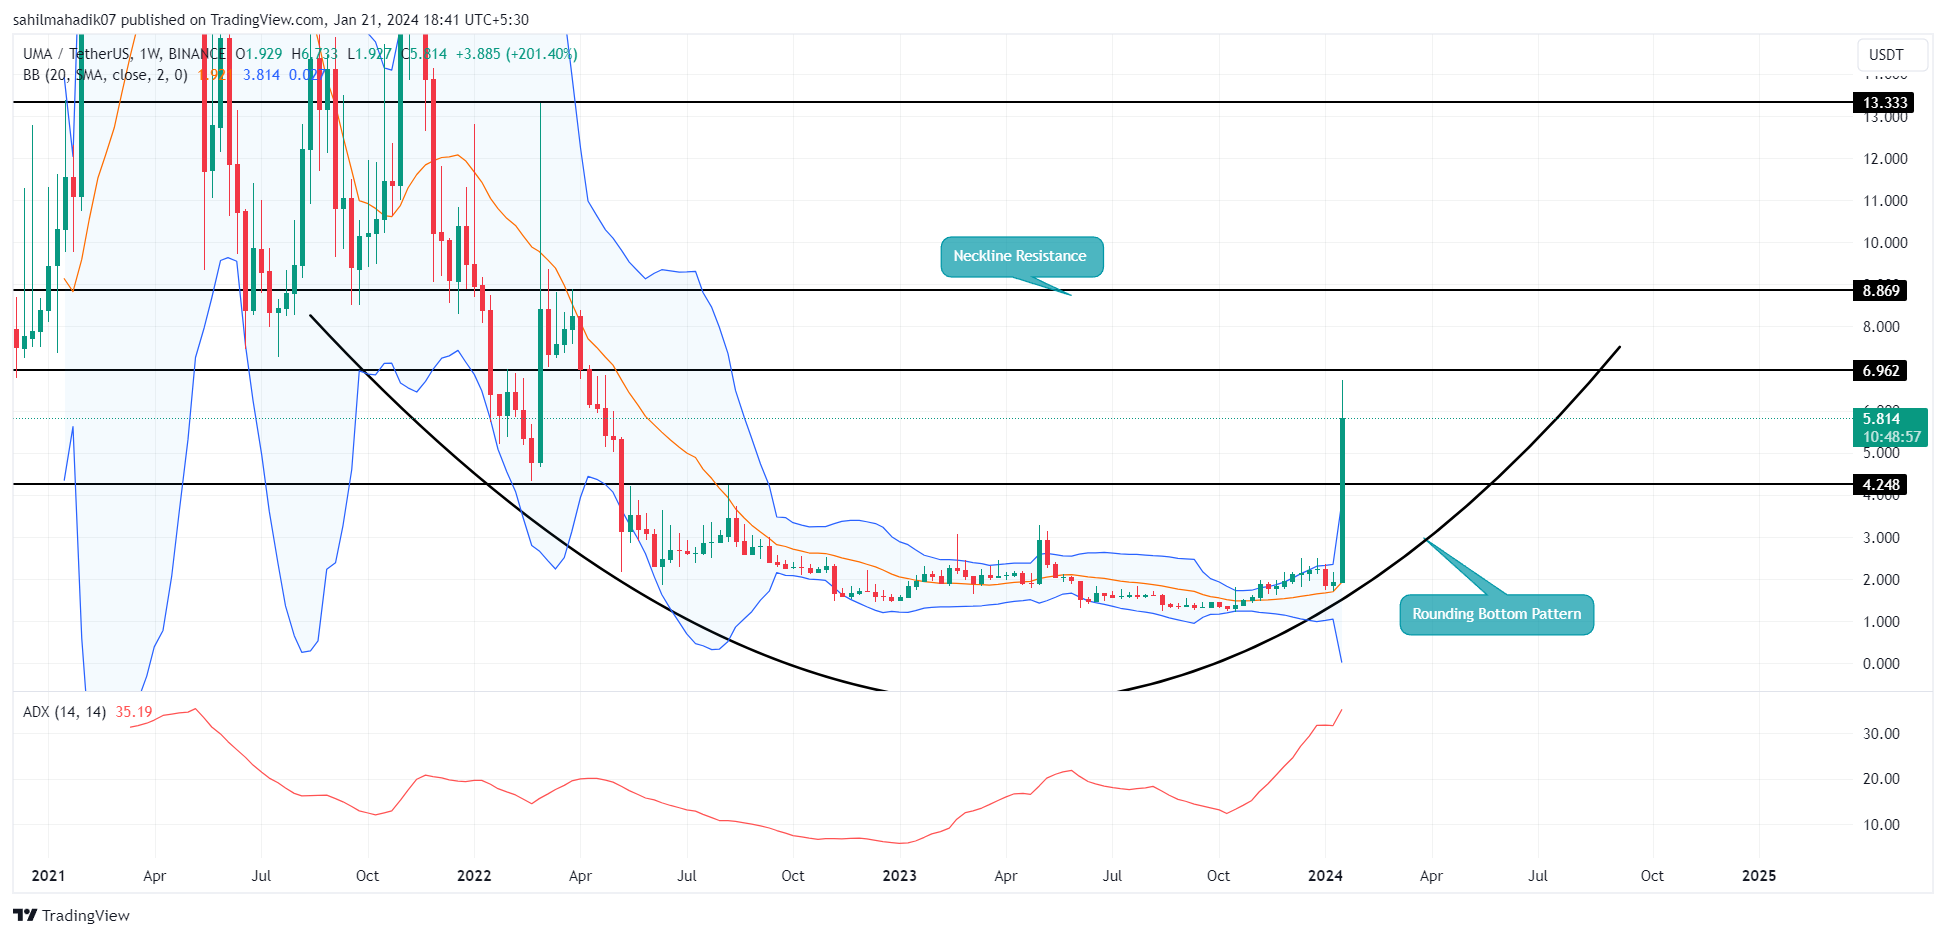
Source: TradingView
The UMA Price has been mostly moving sideways over the last 20 months, with difficulty keeping its value above the crucial resistance level of $4.25. However, when altcoin saw a significant influx of investment earlier this week, the situation drastically changed. Its price increased dramatically as a result of this surge, going from $1.92 to $5.98 in just one week—a startling 210% increase. However, after the initial push, the price per UMA took a slight turn into the red, and as of press time sits at $5,03 per token.
This rally may be related to the impending release of "Oval," a cryptocurrency solution that UMA plans to introduce sometime next week and which, according to UMA Co-founder Hart Lambur in an X Post, will elegantly recover more than $100 million in free money that is lost annually to MEV (Maximum Extractable Value).
The Total Value Secured (TVS) in UMA saw a notable increase in tandem with these developments, hitting a new All-Time High of $775 million.
The UMA price decisively broke out of the $4.25 resistance on January 19, indicating that buyers had pulled out of a 20-month accumulation. The coin price has increased by 25% on January 21, indicating that it is suitable for rapid growth, and was preceded by a retest candle.
A closer look at the daily time frame chart reveals that the UMA price's current recovery is taking the shape of a rounding bottom pattern. The chart set frequently shows an asset's bottom formation and encourages traders to add small amounts over time in hopes of sparking a fresh recovery. The UMA price might offer a fresh entry opportunity with a possible breakout above the $6.92 resistance level if this buying momentum keeps up.
The UMA price is expected to pursue the $13.37 neckline resistance under the influence of this pattern, which represents a 128% potential growth.
token cryptocurrency news crypto news Crypto Price