02 Oct 2023 Arjun Agarwal
Uptober For Crypto? Bitcoin Skyrockets To $28,500
After a dramatic increase in the price of Bitcoin (BTC), Ether (ETH), and other cryptocurrencies on October 1, more than $70 million in short positions in cryptocurrencies were abruptly liquidated.
Bitcoin jumped 3% in just 15 minutes, from $27,100 to $28,053, according to TradingView statistics, before leveling off just below the $28,000 mark at the time of writing.
Ether, the native currency of Ethereum, also increased in value. At one point, it spiked up by as much as 4.7% to $1,755 before leveling off at $1,727 at the time of writing.
The majority of the residents in the neighborhood are perplexed by the unexpected movement. According to several analysts, the change coincided with the start of "Uptober."
It was indicated by some community members that "someone knows something" that others don't.
The term "Uptober" originates from the fact that October tends to be a bullish month for the price of Bitcoin and other cryptocurrencies. Only twice since 2013 have October's monthly returns been negative, according to statistics from CoinGlass.
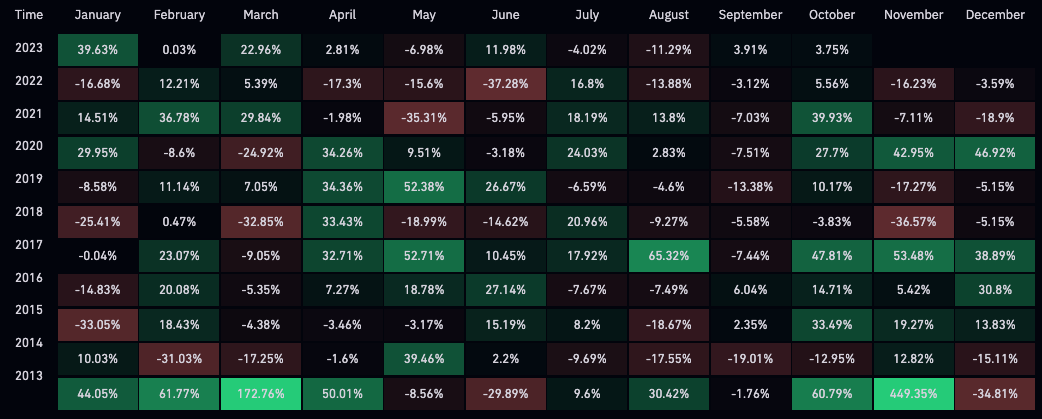 Source: CoinGlass
The possibility of the US Securities and Exchange Commission approving a spot Bitcoin exchange-traded fund is one of the occasions that the cryptocurrency market is anticipating with hope. The majority of analysts, however, believe that January 2024 is the most likely time for such a declaration.
The first meaningful price movement in almost a month may have been welcomed by those holding spot and long positions, but short sellers have had the opposite success.
Short positions worth $70 million were closed down in just two hours due to the quick rise.
The abrupt price change "rekt" approximately $36 million in BTC shorts and $23 million in ETH shorts, according to data from CoinGlass.
Technical analysis
The RSI on a weekly basis is optimistic. A common statistic used by traders to assess momentum and guide their buy/sell decisions on assets is the RSI. A reading above 50 is seen as bullish and a reading below 50 as bearish, especially when the index is rising.
The indicator is rising and above 50, two indicators of a bullish trend. Another indicator of bullish tendencies, the current gain shows that the prior dip below 50 (red circle) is just a divergence.
A bullish reading is also provided by the daily timeframe's technical analysis. The price of Bitcoin has broken out from a trendline of downward resistance, indicating that the last correction is over.
At $28,350 to $29,150, BTC is currently trading between the 0.5 and 0.618 Fib retracement resistance level. The future trend will largely depend on whether it is approved or rejected.
The daily RSI, which is over 50 and rising upwards, supports the continuous gain, just like the weekly period does. The price may rise another 10% to the yearly high at $31,450 if it closes above the 0.618 Fib retracement line.
Despite this optimistic forecast for the price of bitcoin, a rejection from the 0.5-0 and 618 regions is anticipated to result in a 7% decline. This would result in a 7% drop in the price of Bitcoin to the descending resistance line at $26,500.
Bitcoin Ethereum btc eth Ethereum news Bitcoin price bitcoin news cryptocurrency news crypto news Crypto Price Ethereum Price